Customise
Bespoke content and power features
Create unique engaging experiences

Change … everything!

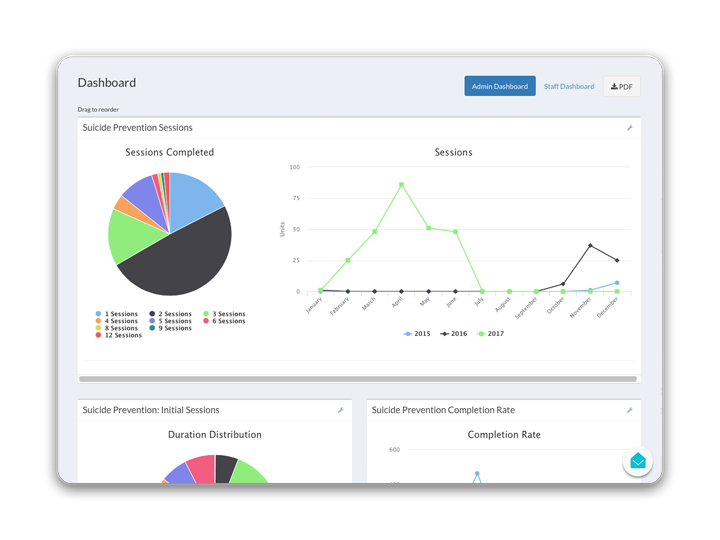
Custom dashboards
A dashboard is a chart or other report on the usage of your workflows and modules, which you can customise for staff or administrators.
Dashboards provide instant overviews for comparison of workflows on your tenancy and to get snapshots of engagement, events and activity.
You can pin a dashboard to different locations in the system to allow access to your staff. If you want to customise what your staff see when logging into their dashboard you can 'pin' pre-existing charts or add a custom report.

Custom reports
Create Reports using the tools you use every day. A report can be embedded, attached to emails, dashboards, or in a module as a report question. You can use piped code or any template variable.
Some example uses of reports include:
Send a completion certificate
Generate a downloadable chart
Review overall progress of participants
Review engagement of subsets of content

Commission custom question types
Bespoke question types
We can create new question types or augment existing question types to provide additional power features and customisation.
We were commissioned to create a new more powerful slider question type to enable researchers to design their ultimate custom tool.
The new slider included a range of very specific requirements to enable the creation of very granular and custom measurements.
The new question type included a range of display options to encompass the options the client needed.

Engageable uses the TWIG templating language
TWIG templating language
Engageable templating language is used to present Excel and Word documents or HTML based on answers or tag values within a workflow. Engageable provides access to the TWIG templating language within certain areas of the platform, including:
Workflow, module, task and question descriptions.
HTML Reports and Excel Reports
Question Text and Descriptions
Website content blocks
Engageable includes webhooks and export functions
Webhooks & data export
There are a range of ways to structure your data within Engageable to make it easy to export for statistical analysis or inclusion in mandatory reporting systems:
Exports your data as CSV
Export dashboards as PDF
Set column names within workflows
Create custom exports for simple import into your desired portals or datasets

Create reports from MS Office in Engageable
Built from MS Office ™
Reports can be embedded attached to emails, dashboards, or in a module as a report question.
Some example uses of reports are:
Send a completion certificates
Generate a downloadable charts
Generate an official documents using mandated templates
Create a report using Word or Excel and complete the values required automatically from data gathered in Engageable.

Mobile Apps connected to your admin suite
Mobile compatible & Apps
Mobile Applications have a reputation for being challenging and expensive to create and maintain. Our developers have been building Apps since the App Stores first arrived and have a wealth of experience with Apple iOS and Google Android.
Every tenancy is mobile optimised to ensure that your participants can use your content on their smartphones or tablets and save as web apps on their home screens.
We can apply customised icons for your web apps.

Commission custom games
Games & gamification
A popular use for Engageable is to deliver e-learning and interventions to younger audiences that relate well to games and gamification of content.
Our staff can help you create interactive games that you design, whilst ensuring that the interactions gather the data you need.
Coupled with rewards, resources and re-engagement tools, you can introduce competitive elements to your audience including comparisons with peers, scoring and time limits.

Graphic design services
Bespoke graphic design
There’s nothing better to help engage your participants than bespoke graphic design. You may need our graphic designers to:
Design Icons, Badges and Rewards
Locate stock photography or create new images
Create elements for games, videos, illustrations or stories
Create videos and overlays
Customise your tenancy visually

Content design services
Bespoke content design
Getting the best out of the powerful workflow creator can be challenging for new users. Or you may just be short on time. We understand how users interact with content and can help you by;
helping to develop information architecture
testing content for readability, comprehension and findability
reducing the amount of content
ensuring content is accessible and inclusive
ensuring your content is tailored to take advantage of Engageable’s hierarchy and features

Gather data from wearables
Connect wearable devices
Engage our developers to connect wearable devices such as smart-watches, pedometers or digital scales etc.
Add data to your dashboards and reports
Collect additional data in real time
Ideal for health and sports applications
Make your tenancy even more powerful

Engageable selectors
Selectors
Staff members can only see the users they are meant to work with and can only see identifying information if permitted.
Selector Types:
Users - Basic type to display a list of users
User Episodes - For when you need to create an episode of engagement
Incidents - Good for audits or accident reports
Placements - When you need a workflow for training placements

Different content/visibility for users in different locations
Locations & team tasks
Locations are a mechanism to sub-divide users and/or content.
Location Plans let your users map out what needs to be done at their location.
Team Tasks are a way to have a to-do list at each location for your team. It is a way to project manage face to face visits, training, interviews, module completion or really any task required at each location you manage.
Phases: Each task must be part of a phase. Phases are completed in order and can have a start delay and a duration.
and more…